NHL Analysis (1963 - 2022)

This is my very first project using pandas and matplotlib altogether. In this entry, I will show some analytics I made with this database. Shoutout to OP for the dataset!
Import the libraries and .csv file
import pandas as pd #graphs
import numpy as np
import matplotlib.pyplot as plt

df = pd.read_csv('nhldraft.csv')
df.head()
id
year
overall_pick
team
player
nationality
position
age
to_year
amateur_team
...
points
plus_minus
penalties_minutes
goalie_games_played
goalie_wins
goalie_losses
goalie_ties_overtime
save_percentage
goals_against_average
point_shares
0
1
2022
1
Montreal Canadiens
Juraj Slafkovsky
SK
LW
18.0
NaN
TPS (Finland)
...
NaN
NaN
NaN
NaN
NaN
NaN
NaN
NaN
NaN
NaN
1
2
2022
2
New Jersey Devils
Simon Nemec
SK
D
18.0
NaN
HK Nitra (Slovakia)
...
NaN
NaN
NaN
NaN
NaN
NaN
NaN
NaN
NaN
NaN
2
3
2022
3
Arizona Coyotes
Logan Cooley
US
C
18.0
NaN
USA U-18 Development Team (USDP/USHL)
...
NaN
NaN
NaN
NaN
NaN
NaN
NaN
NaN
NaN
NaN
3
4
2022
4
Seattle Kraken
Shane Wright
CA
C
18.0
NaN
Kingston Frontenacs (OHL)
...
NaN
NaN
NaN
NaN
NaN
NaN
NaN
NaN
NaN
NaN
4
5
2022
5
Philadelphia Flyers
Cutter Gauthier
SE
LW
18.0
NaN
USA U-18 Development Team (USDP/USHL)
...
NaN
NaN
NaN
NaN
NaN
NaN
NaN
NaN
NaN
NaN
5 rows × 23 columns
Players drafted by age
ax=df['age'].plot(kind='hist',ylabel='Q',xlabel='age',bins=20,color='pink',title='PLAYERS DRAFT AGE')

#axis name change

ticks = np.arange(df['age'].min(), df['age'].max()+1,2)
ax.set_xticks(ticks)
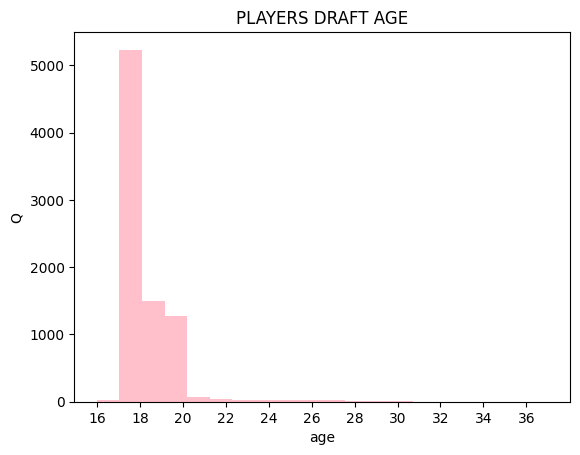
As expected, most of these guys are 18 years old. You can also see that a few players were younger than 18 — these correspond to the years 1955–1967, before the Junior Hockey regulations changed to set the age range to 18–20 for Canadian and American players, and 18–21 for international players. You can read more about this here.
Teams with less and most players drafted.
# less
df['team'].value_counts().nsmallest(15).plot(kind='barh',figsize=(10,10),title='TEAMS WITH LESS PLAYERS DRAFTED',color='pink')

# most
df['team'].value_counts().nlargest(6).plot(kind='barh',figsize=(10,10),color='pink',title='TEAMS WITH MORE PLAYERS DRAFTED')
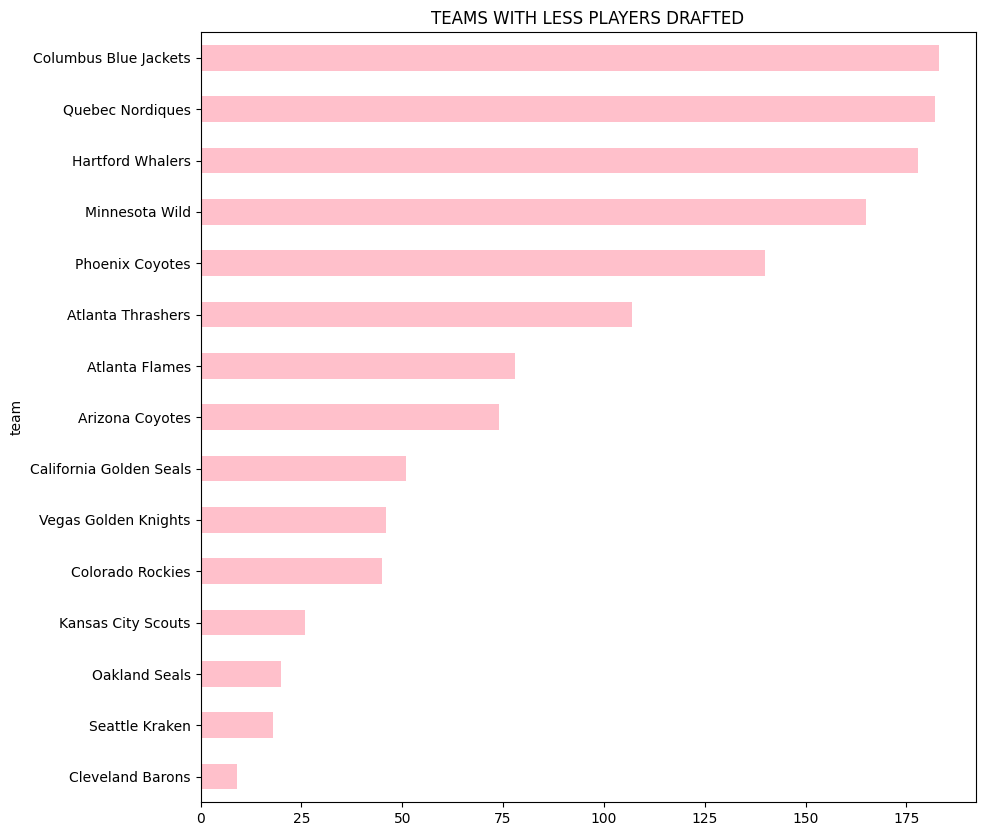
Still not a very surprising result — the teams that drafted the fewest players are the newest franchises (such as the Kraken, the Vegas Golden Knights, and the Minnesota Wild), as well as teams whose franchises are no longer active.
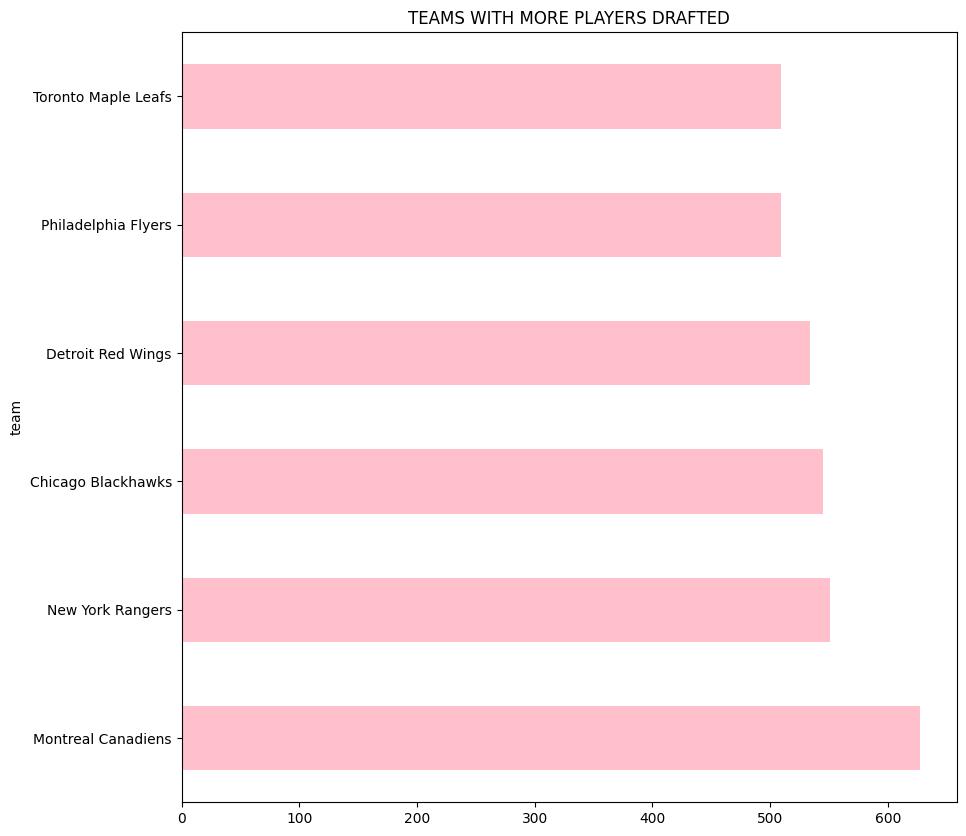
Here, I purposely created a Top 6 to see whether all the "Original 6" teams would appear — but surprisingly, they didn’t. The Leafs barely made the list, and the Flyers ended up taking the Bruins’ spot instead.
The Flyers ranking so high reflects their drafting approach during the 80s and 90s, where they accumulated more mid-round picks than most Original Six teams. Of course, drafting many players doesn’t necessarily mean drafting successful players.
The gap between the Leafs and the top teams is also smaller than expected, showing how consistent their draft activity has been across decades despite mixed on-ice results.